Malawi Climate Risk Dashboard
Overview
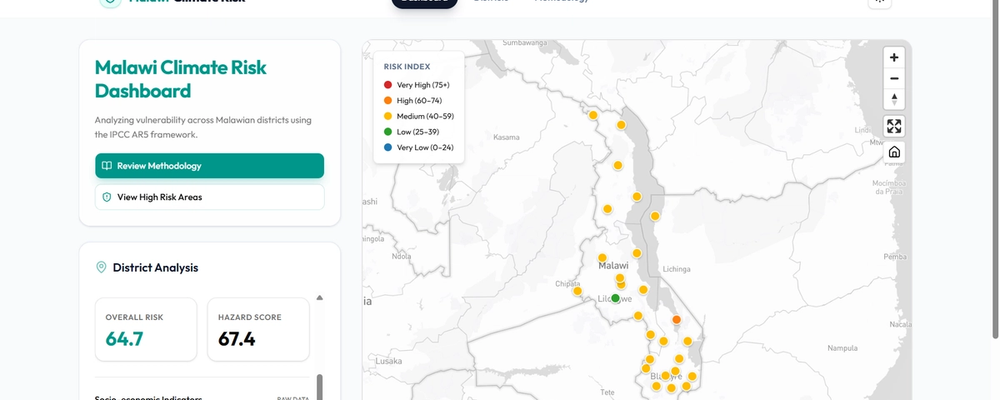
A national climate risk assessment platform applying the IPCC AR5 risk framework to all 28 Malawian districts. The platform processes 50,000+ daily meteorological records alongside socioeconomic and disaster exposure data to produce composite risk scores, visualised through an interactive map with per-district breakdowns.
The Problem
District-level climate risk in Malawi was either locked in static PDF bulletins or buried in technical datasets inaccessible to non-specialists. Policymakers needed a way to compare districts, understand the drivers of risk, and communicate findings to stakeholders — in under five seconds, on a mobile device.
Methodology
Risk is computed as:
Risk = ³√(Hazard × Exposure × Vulnerability)
Following the IPCC AR5 multiplicative model. Indicators are normalised using robust percentile clipping (5th–95th) to handle extreme outliers. Data sources:
- Climate hazard: NASA POWER daily data (2020–2024) — SPI, rainfall variability, heat stress days
- Exposure: WorldPop 2020 (UN-adjusted population density), EM-DAT disaster records (2000–2024)
- Vulnerability: World Bank Development Indicators (2020) — poverty rate, literacy, health and water access
Architecture
The scoring engine is written in Python. A FastAPI backend exposes a REST endpoint with a startup-time cache — the expensive per-district computation runs once at container boot, not on every request. The Next.js frontend consumes this API and renders district data client-side, with no server round-trip on district selection.
The frontend was migrated from a 583-line Streamlit prototype. The science — scoring model, indicator set, weightings, normalisation logic — was preserved exactly. The migration was a presentation and deployment concern only.
Key Features
- Interactive Mapbox GL JS choropleth of all 28 districts
- Click-to-select district panel with component-level risk breakdown
- Sortable, searchable districts table
- Dedicated methodology page with full formula and indicator documentation
- Dark mode, mobile-responsive layout