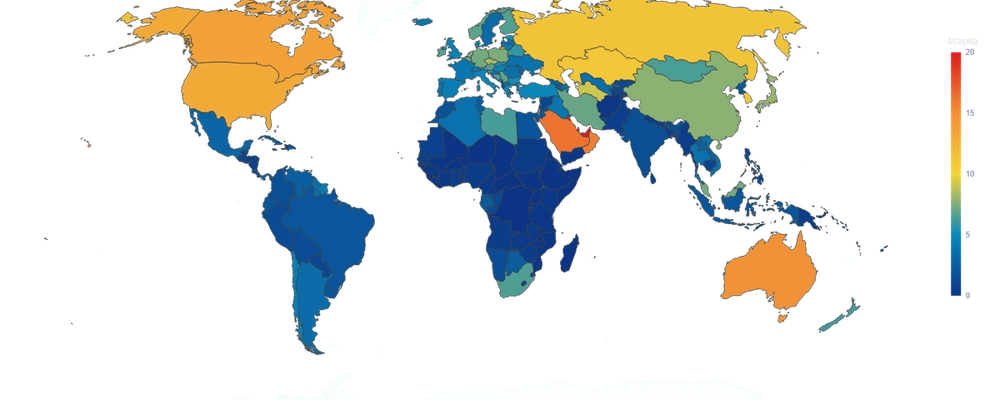
Interactive world map visualizing CO₂ emissions per capita across countries from 1990-2020. Built with Streamlit and Plotly, featuring dynamic year selection, global choropleth maps, and top emitters analysis. Data sourced from World Bank ESG indicators.